Monitoring is one of the Important part of your Infrastructure which is mandatory to have. None of the Infrastructure is always stables and cannot be kept without monitoring and Alerting. Here We will be looking into how we can Monitor our Servers and even Docker Containers running inside the Server using Grafana, Prometheus, Node Exporter, CAdvisor.
Let’s have a brief look at all the above mentions components before we Start with the practical implementation.
1. Grafana: Its a tool which allow to Visualize, Query, Alert your Server Metrics. It requires to have a Data Source, Which can Prometheus, Influx, Aws Cloudwatch, etc. You can Create your beautiful Metrics Dashboard and Can Visualize the See the Status of your Servers like CPU Utilizations, Memory, Disk, etc.
2. Prometheus: It is a Monitoring and Alerting tool, It provides querying and collecting the multi-dimensional data. It is one of the Popular Data Source for Grafana.
3. Node Exporter: The Prometheus Node Exporter has wide varieties of Server Metrics. Its Captures all the Linux Hardware and Kernel Related metrics.
4. CAdvisor: It Stands for Container Advisor and used to aggregate and process all the metrics for the running Containers.
Note: For this particular tutorial, We will be Setting up all these components on top of the docker container. though these can be installed and configured from the binaries and can be build from the source.
Prerequisite,
1. A Linux machine
2. Docker Installed.
3. Docker Compose Installed
I will be Breaking this Blog into 5 parts so each and every blog will be small and will be easy to Understand and Implement,
- Setup Prometheus, Grafana, node exporter and CAdvisor.
- Creating a Dashboard
- Notification to Slack using Alert Manager
- Notification to Slack from Grafana
- Adding other Nodes for monitoring in Grafana.
So Let’s get Started.
Login to your Linux machine, Update the repository and Install Docker and Docker Compose. To Update the Repository,
ubuntu@devopsage:~$ sudo apt update
Create a Directory, say monitoring
ubuntu@devopsage:~$ mkdir monitoring
ubuntu@devopsage:~$ cd monitoring/
ubuntu@devopsage:~$ vim docker-compose-mon.yml
Now, Create a Docker Compose file for Prometheus, You also need to Create a Prometheus configuration file, prometheus.yml
Docker Compose file for Prometheus is below,
Note: We will keep on extending the same docker file as we will move ahead to install other components.
version: '3'
services:
  prometheus:
    image: prom/prometheus:latest
    volumes:
      - ./prometheus.yml:/etc/prometheus/prometheus.yml
      - ./prometheus_db:/var/lib/prometheus
    command:
      - '--config.file=/etc/prometheus/prometheus.yml'
    ports:
      - '9090:9090'
Create a Prometheus configuration file and paste the config as below.
global:
  scrape_interval: 5s
  external_labels:
    monitor: 'devopsage-monitor'
scrape_configs:
  - job_name: 'prometheus'
    static_configs:
      - targets: ['172.31.26.111:9090'] ## IP Address of the localhost
Compose file consists of the volume mapping to the container, one is the Prometheus configuration and the second one (prometheus_db) is to store the Prometheus database locally. Now run the docker compose.
Note: The above yml file may have the indentation issue, so there might be a possibility that docker compose will fail with indent error. Please get the Compose and other configuration files from the devopsage official GitHub page.
ubuntu@devopsage:~/monitoring$ mkdir prometheus_db
ubuntu@devopsage:~/monitoring$ docker-compose -f docker-compose-mon.yml up -d
Access Prometheus using the IP and Port and you will see the Prometheus UI.
http://ip_address:9090
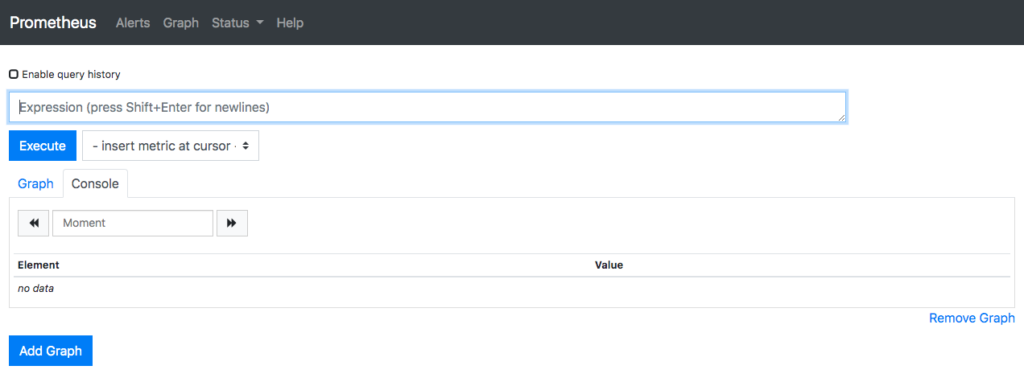
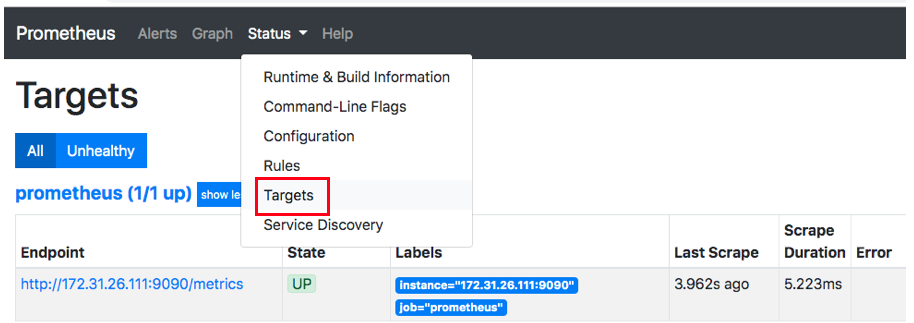
Click on target from the status tab and you will see that the Prometheus is one of the targets so far and is in UP state.
Now We will Setup the Node Exporter. It is one of the best component used along with the Prometheus to capture metrics from the server where the Prometheus is running. It Captures all hardware and kernel related metrics like CPU, Memory, Disk, Disk Read/Write, etc.
To Install the Node exporter, simply append the docker-compose-monitor.yml file and prometheous.yml file as below.
node-exporter:
  image: prom/node-exporter
  ports:
    - '9100:9100'
Append the prometheus.yml as below,
- job_name: 'node-exporter'
  static_configs:
    - targets: ['172.31.26.111:9100']
So now the Composite docker-compose file will looks like below,
version: '3'
services:
  prometheus:
    image: prom/prometheus:latest
    volumes:
      - ./prometheus.yml:/etc/prometheus/prometheus.yml
      - ./prometheus_db:/var/lib/prometheus
    command:
      - '--config.file=/etc/prometheus/prometheus.yml'
    ports:
      - '9090:9090'
  node-exporter:
  image: prom/node-exporter
  ports:
    - '9100:9100'
And prometheus.yml will look like below,
global:
  scrape_interval: 5s
  external_labels:
    monitor: 'devopsage-monitor'
scrape_configs:
  - job_name: 'prometheus'
    static_configs:
      - targets: ['172.31.26.111:9090']
  - job_name: 'node-exporter'
    static_configs:
      - targets: ['172.31.26.111:9100']
Now Create the Node Exporter Container and Restart the Prometheus container using the below commands
ubuntu@devopsage:~/monitoring$ docker-compose -f docker-compose-mon.yml create node-exporter
ubuntu@devopsage:~/monitoring$ docker-compose -f docker-compose-mon.yml start node-exporter
ubuntu@devopsage:~/monitoring$ docker-compose -f docker-compose-mon.yml restart prometheus
OR, You can Simply do compose up and down.
ubuntu@devopsage:~/monitoring$ docker-compose -f docker-compose-mon.yml down
ubuntu@devopsage:~/monitoring$ docker-compose -f docker-compose-mon.yml up -d
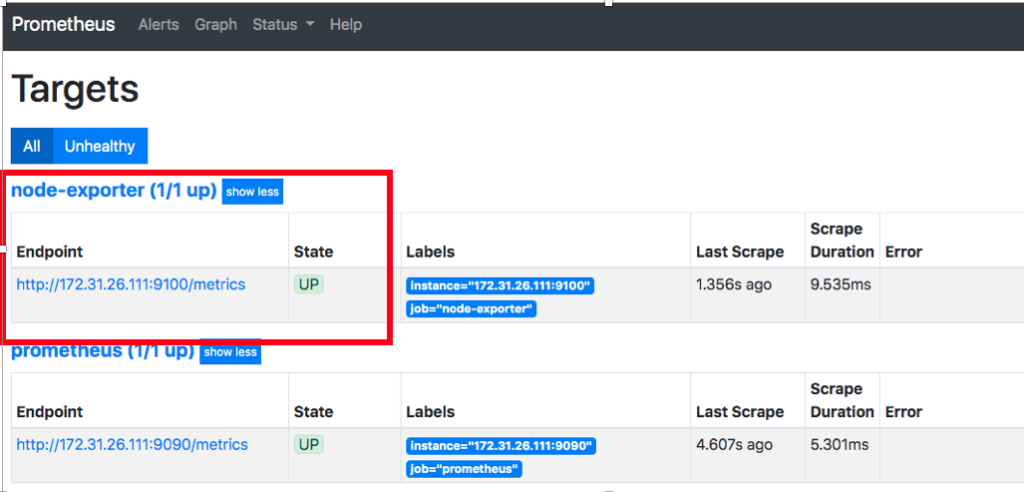
Now See the Targets in Prometheus, you will see node exporter as well as a target.
Now, Setup CAdvisor, for this append the docker compose with below code.
cadvisor:
  image: google/cadvisor:latest
  ports:
    - '8080:8080'
  volumes:
    - /:/rootfs:ro
    - /var/run:/var/run:rw
    - /sys:/sys:ro
    - /var/lib/docker/:/var/lib/docker:ro
Also, Append the prometheus.yml with a bit code yml code. We are actually adding the CAdvisor service in prometheus configuration.
- job_name: 'cAdvisor'
  static_configs:
    - targets: ['1172.31.26.111:8080']
Access CAdvisor from the URL,
http://IP_Address:8080/docker/
Now eventually we will set up the grafana, where we will be using Prometheus as a data source. We can have a better Dashboard in grafana for the metrics visualization.
Append the code in the above docker compose and restart.
grafana:
  image: grafana/grafana
  user: "1000"
  environment:
    - GF_SECURITY_ADMIN_PASSWORD=secure_pass
  volumes:
    - ./grafana_db:/var/lib/grafana
  depends_on:
    - prometheus
  ports:
    - '3000:3000'
Access grafana UI from 3000 port, default user will be admin and the password you set in the compose file.
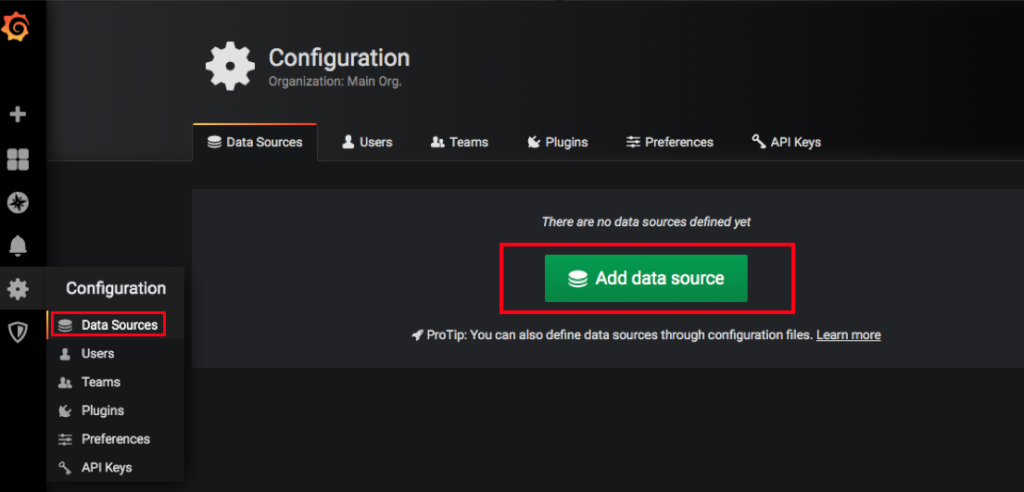
Adding a Data Source
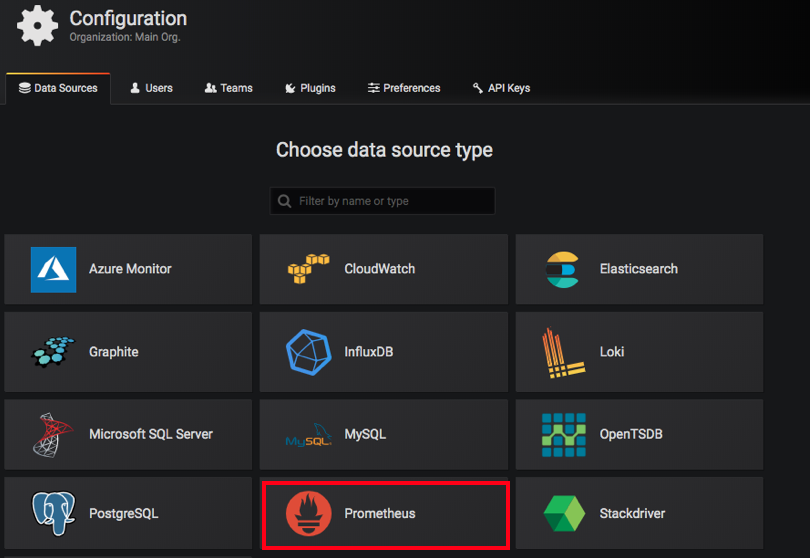
Click on Data Source from Setting and Click Add data source. You will see all the supported data source, just select Prometheus out of the list.
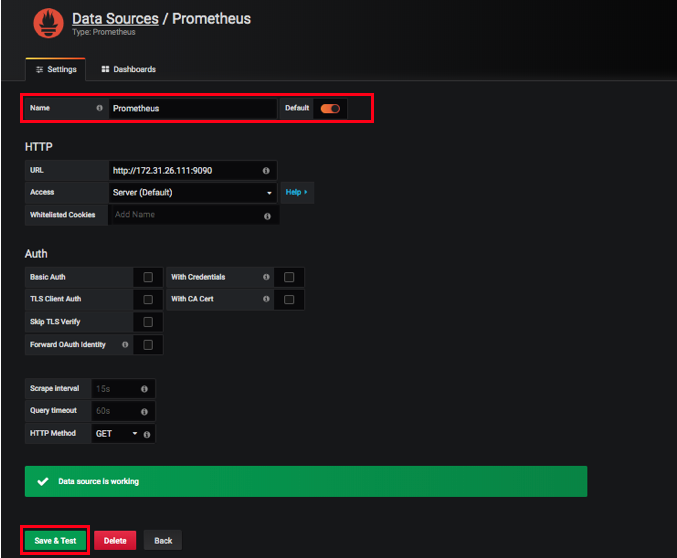
Provide the URL and Click Save and Test. This will Now add Prometheus as a data source, using which we can add metrics to grafana and can create beautiful dashboards
That’s it for this Particular blog, In this Articles so far we have seen the Setup of Grafana, Prometheus, CAdvisor, Node Exporter. In the Next Article, We will have a look at how we can create some dashboard in grafana for visualization.
If you Like Our Content here at Devopsage, then please support us by sharing this post.
Please Like and follow us at, LinkedIn, Facebook, Twitter, and GitHub
Also, Please comment on the post with your views and let us know if any changes need to be done.
Thanks!!
You May Also Need to look Into,
Notification to Slack using Prometheus AlertManger
Creating Dashboard in Grafana
thanks. a small addtions:
your code not working. it cause erre:
“`ERROR: for monitoring_prometheus_1 Cannot start service prometheus: OCI runtime create failed: container_linux.go:349: starting container process caused “process_linux.go:449: container init caused \”rootfs_linux.go:58: mounting \\\”/Users/pk/repo/oxor-docker/monitoring/prometheus.yml\\\” to rootfs \\\”/var/lib/docker/overlay2/a75580caa0d472cbf6b27c734170143dea9cbad56d2cf98b0a43febd326ab71b/merged\\\” at \\\”/var/lib/docker/overlay2/a75580caa0d472cbf6b27c734170143dea9cbad56d2cf98b0a43febd326ab71b/merged/etc/prometheus/prometheus.yml\\\” caused \\\”not a directory\\\”\””: unknown: Are you trying to mount a directory onto a file (or vice-versa)? Check if the specified host path exists and is the expected type
“`
I move prometheus.yml inside prometheus folder and change docker volune to
`- ./prometheus:/etc/prometheus`
Hope in helps. cheers!
and
Nope. I was wrong. I didn’t help for my DO machin (for local mac machine it works. what the problem – I can’t understand..
here is a error:
“`
ERROR: for prometheus Cannot start service prometheus: OCI runtime create failed: container_linux.go:349: starting container process caused “process_linux.go:449: container init caused \”rootfs_linux.go:58: mounting \\\”/Users/pk/IdeaProjects/promgrafana-monitor/prometheus.yml\\\” to rootfs \\\”/var/lib/docker/overlay2/39cfce0724abd0863826122da78f6e11888ac80b73da7796c85c8a7829c6790e/merged\\\” at \\\”/var/lib/docker/overlay2/39cfce0724abd0863826122da78f6e11888ac80b73da7796c85c8a7829c6790e/merged/etc/prometheus/prometheus.yml\\\” caused \\\”not a directory\\\”\””: unknown: Are you trying to mount a directory onto a file (or vice-versa)? Check if the specified host path exists and is the expected type
ERROR: Encountered errors while bringing up the project.
“`
I run the exact file from Github repo.
“`
mkdir prometheus_db grafana_db && docker-compose -f docker-compose-mon.yml up -d
“`
Hi Skywinder,
I suspect the issue is with the directory structure. The error message says that you are trying to mount directory onto a file (or vice versa). Check if the specified host path exists and is the expected type.
While mounting, the required directory and files does not seems to be in place and the above error is expected.
Try as below,
# git clone https://github.com/devopsage/promgrafana-monitor.git
# cd promgrafana-monitor
# mkdir prometheus_db grafana_db (empty directory which will store prom and grafana data)
Note: make sure to update targets in prometheus.yml file referring to your IP
# docker-compose -f docker-compose-mon.yml up -d
This should probably work.