In the Previous Post, we have seen how we can use Notification channel of Grafana to send Alert on Slack. In this particular blog we will how we can add another node to be monitored in Grafana
Make Sure, you have Grafana up and running, also make sure you have docker and docker-compose installed on the Server which you wanted to put in Grafana for monitoring purpose.
Let’s get started,
Login to the Node which needs to be added to the centralized Grafana, We need to create a container for Prometheus, Node Exporter and CAdvisor which we will be pointing to the Existing Grafana running on the different Server. Create a docker-compose file and paste the below YAML code to create containers. Also, create a directory structure before.
# mkdir node
# cd node
# mkdir prometheus_db
# vim docker-compose-node.yml
Paste the Below YAML code for Prometheus, node exporter, and CAdvisor
version: '3'
 services:
   prometheus:
     image: prom/prometheus:latest
     volumes:
       - ./prometheus.yml:/etc/prometheus/prometheus.yml
       - ./prometheus_db:/var/lib/prometheus
     command:
       - '--config.file=/etc/prometheus/prometheus.yml'
     ports:
       - '9090:9090'
   node-exporter:
     image: prom/node-exporter
     ports:
       - '9100:9100'
   cadvisor:
     image: google/cadvisor:latest
     ports:
       - '8081:8080'
     volumes:
       - /:/rootfs:ro
       - /var/run:/var/run:rw
       - /sys:/sys:ro
       - /var/lib/docker/:/var/lib/docker:ro
Now Create a prometheus.yml file and paste the Below YAML for the Prometheus configuration.
global:
   scrape_interval: 5s
   external_labels:
     monitor: 'test-node'
 scrape_configs:
   - job_name: 'prometheus'
     static_configs:
       - targets: ['local_private_ip:9090']
   - job_name: 'node-exporter'
     static_configs:
       - targets: ['local_private_ip:9100']
   - job_name: 'cAdvisor'
     static_configs:
       - targets: ['local_private_ip:8081']
Note: Take Care of the Indentation as YAML files are indentation sensitive. For more details refer our previous blog for an end to end setup.
Now, Run the docker-compose file.
# docker-compose -f docker-compose-node.yml up -d
# docker ps
Verify whether all the container is up and running or not. Now once all the containers, i.e, Prometheus, node exporter, and CAdvisor are Up and running, Go ahead and add this node as a data source to the Prometheus.
To check on how to add data source refer to our previous blog here.
You can see that we have already added this node as a data source in the screenshot below with a name Test-Node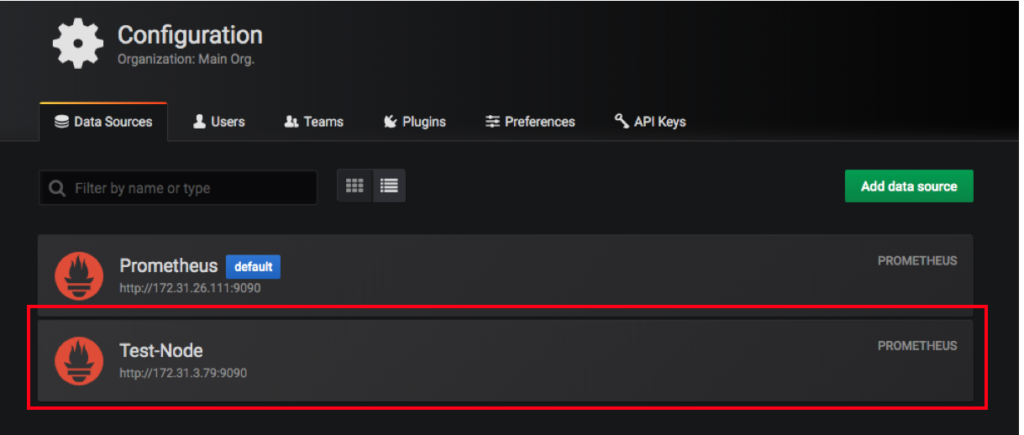
Once the Datasource is added, then we are all set to create our dashboard. You just need to Select the Newly added data source and write your queries. You can have a look at our previous blog if you wanted to know about creating a Dashboard.
If you Like Our Content here at Devopsage, then please support us by sharing this post.
Please Like and follow us at, LinkedIn, Facebook, Twitter, and GitHub
Also, please comment on the post with your views and let us know if any changes need to be done.
Thanks!!
You May Also Need to Look at the below posts,
Creating Dashboard in Grafana
Monitoring Servers and Docker Containers using Prometheus and Grafana.
Notification to Slack using Prometheus AlertManger
Alert Notification to Slack from Grafana