After the setup of the Grafana and Prometheus in the previous section of this Article, now we are going to create some attractive Dashboard to Visualize and monitor. In the Previous Section, we have also Seen that how we can add a Data Source to the Grafana and already added Prometheus as a Data Source.
So let’s get started and create a Dashboard for CPU, Memory, Disk, Server Uptime, etc.
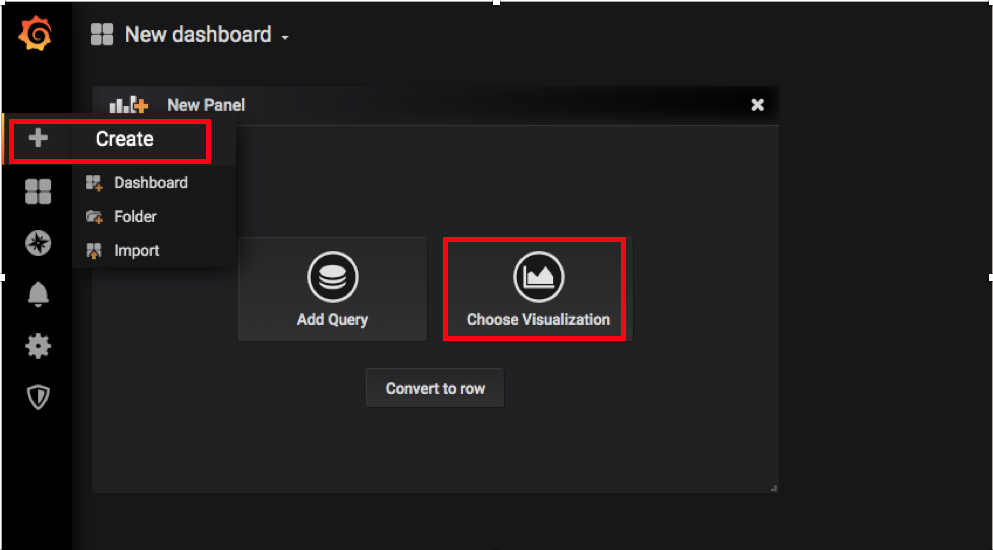
Click On + Icon and the Click Create, Now select Choose Visualisation
You, Will, See all the Visualization there, You Just need to select out of it according to your design pattern. For now, Select Singlestat for Creating the Dashboard for Server Uptime.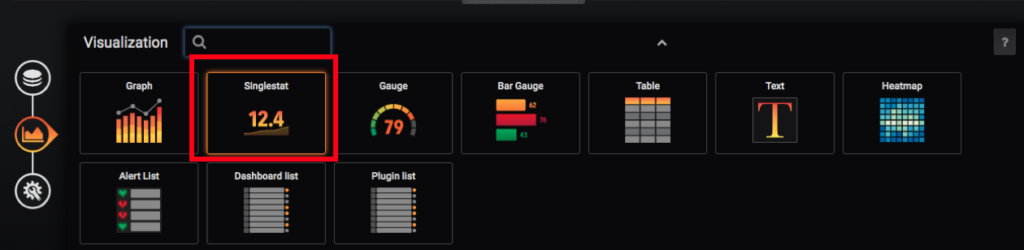
Now, Select the Query Section, Select the Data Source Which We have added earlier and Paste Query in the A tab, these metrics are coming from the Prometheus which we are using it with some form of calculation in order to form metrics. 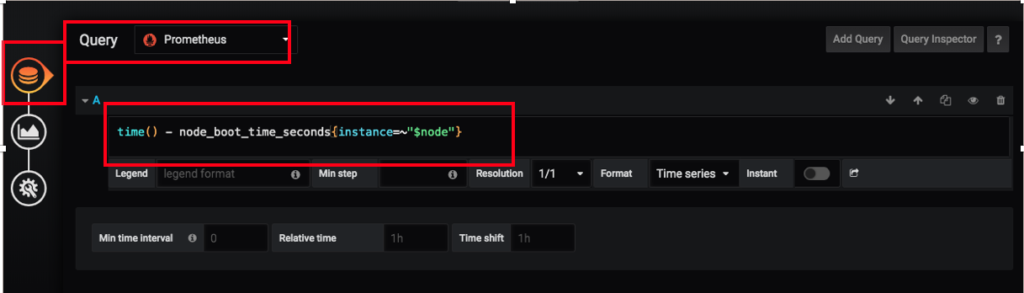
Query : time() – node_boot_time_seconds{instance=~”$node”}
Note: $node is the Variable we are Calling which need to be defined in the variable section of the Dashboard in grafana. Don’t Worry if you are not able to see any Data points to the Metrics.
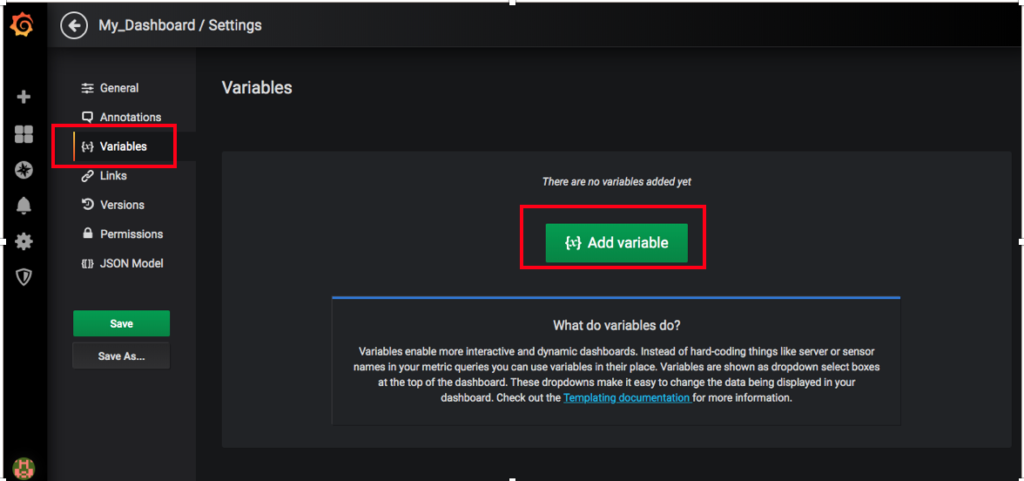
Save the metrics and come out. Let’s add the Variable first. Click On Settings from the top.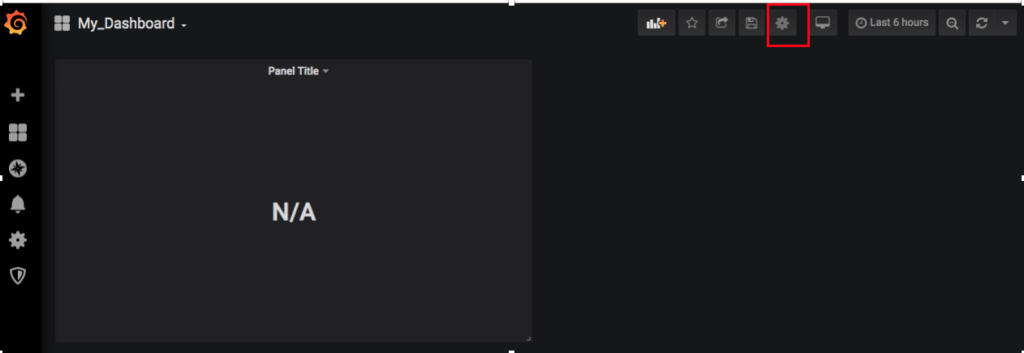
Click variables from the Navigation pane and then Click Add variables.
Now Create First Variable name it as interval and fill up the details as below in the screenshot.

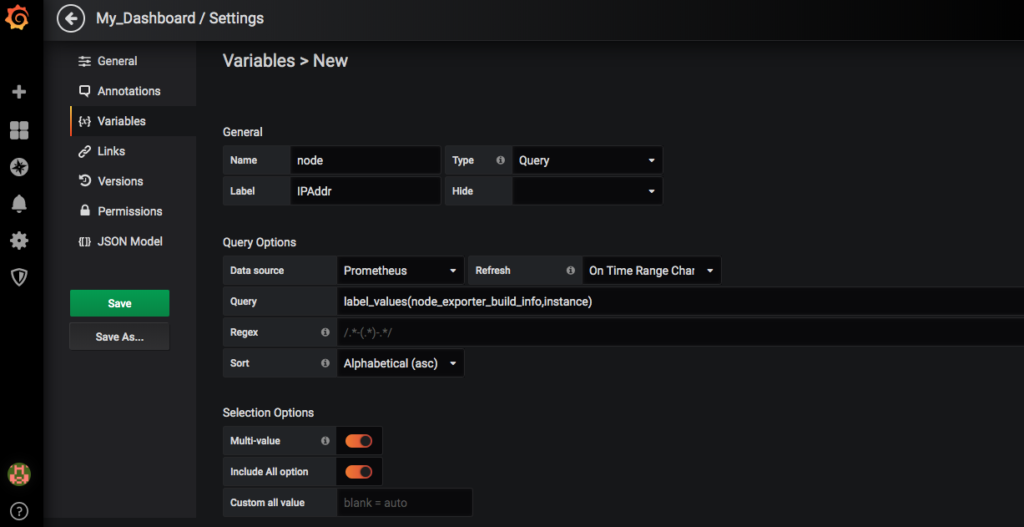
Similarly, create Another Variable named node and select type as query and paste the below query there. Also, put all the values as it is shown in the screenshot below.
Query: label_values(node_exporter_build_info,instance)
Now Click Add and Save to Save Changes. As soon as you do this, you will start seeing some values to the metrics. 
This Does not look exactly what we want and not even Attractive. So let’s make some changes to it for proper Visualization. Click on the Panel Title and Click Edit

Now you will be in a Visualization tab and you can Modify Values according to your need. For these Metrics change the values like,
Stat: Current
Change the Fonts According to your preference
Unit: Time -> Seconds
Modify the Colouring as per your preference

Now go to the General Section and Put Title for this particular Metrics.

Now Save the Dashboard and go to the home page of the Dashboard and you will see your first metrics created for Server Uptime.
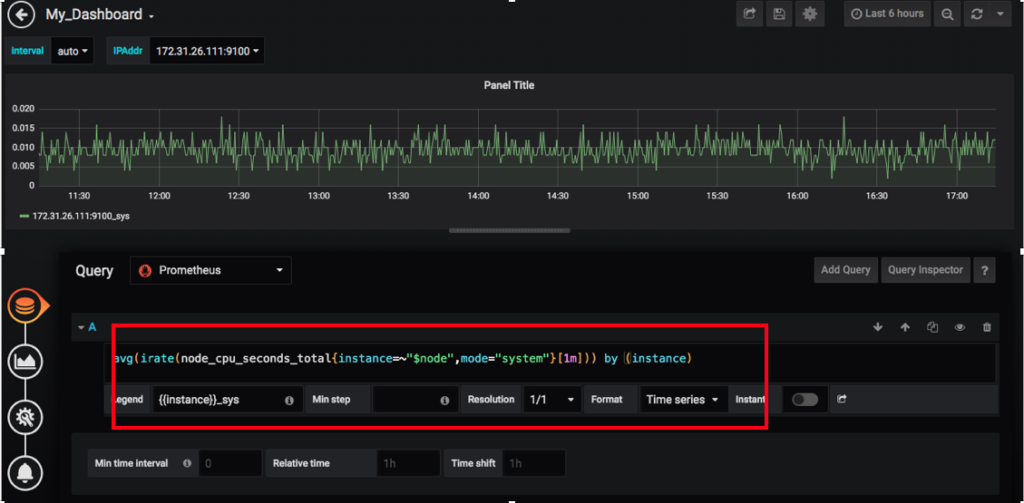
Now let’s add other Metrics for CPU Utilization, Click Add panel from the top and choose visualization as we did to create the previous metrics. To create a CPU Metrics Select Graph and go to the Query Tab and paste below query
Query: avg(irate(node_cpu_seconds_total{instance=~”$node”,mode=”system”}[1m])) by (instance)
Legend: {{instance}}_sys
Legends are basically the Marker below the metrics which defines for what particular metrics this graph is created
Now, Let’s Change the visualization section to make it more beautiful and readable.
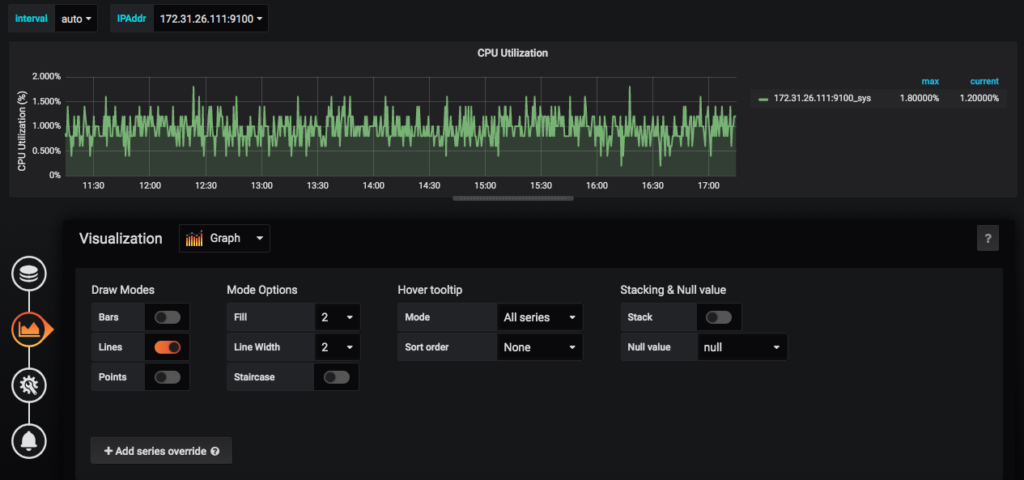
Scroll down and modify the Axis Section and legend Section as Shown in the Screenshot below.
Axis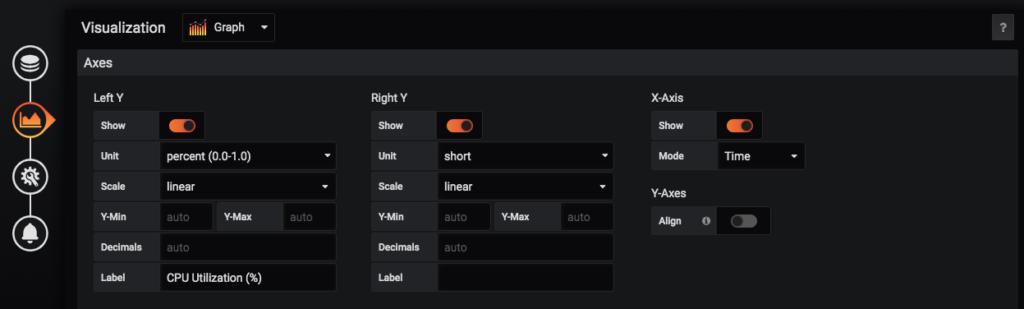
Legend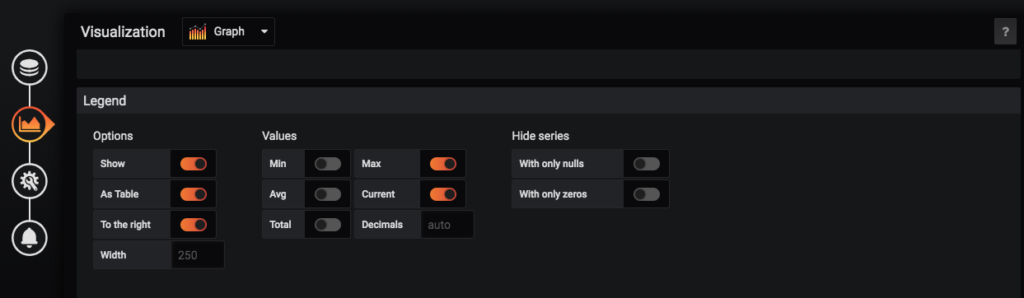
Save the Dashboard and go to the Home page of the Dashboard. It should be like below,

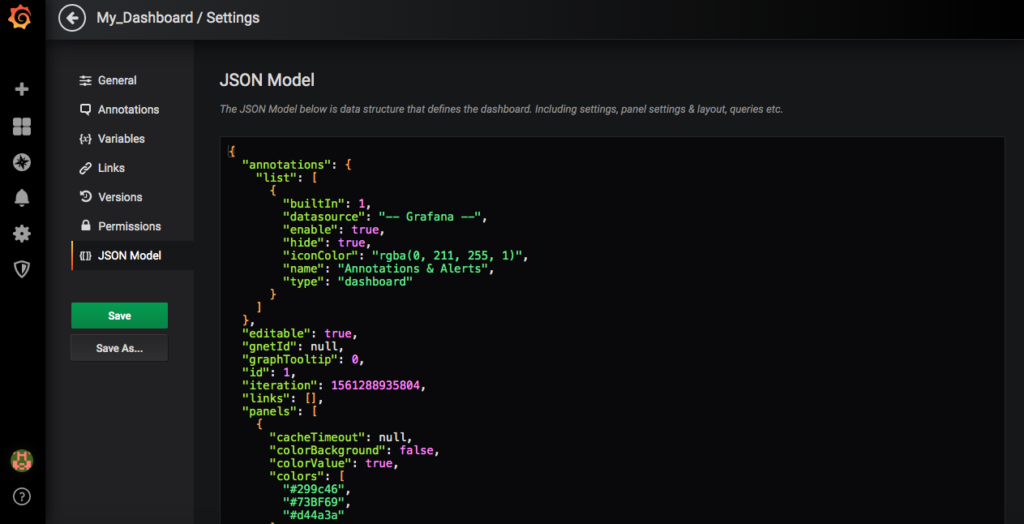
Similarly, We can create the metrics as per our requirement and can arrange it as per our preferences. Once you have created the Dashboard, you also can export the JSON file of it and can import to other grafana to create the Same Dashboard. Just Click the Setting of the Dashboard, then go to the JSON Model and there you will find the Json file for the dashboard you have created. As you will keep on adding the Metrics, the Json file will keep on Updating.
I will Show you how we can import the JSON file to create a Dashboard. I have created the Dashboard following the above steps we have implemented and tried to cover the most important hardware Metrics. You Can get this json model from the DevOpsage official Github Link.
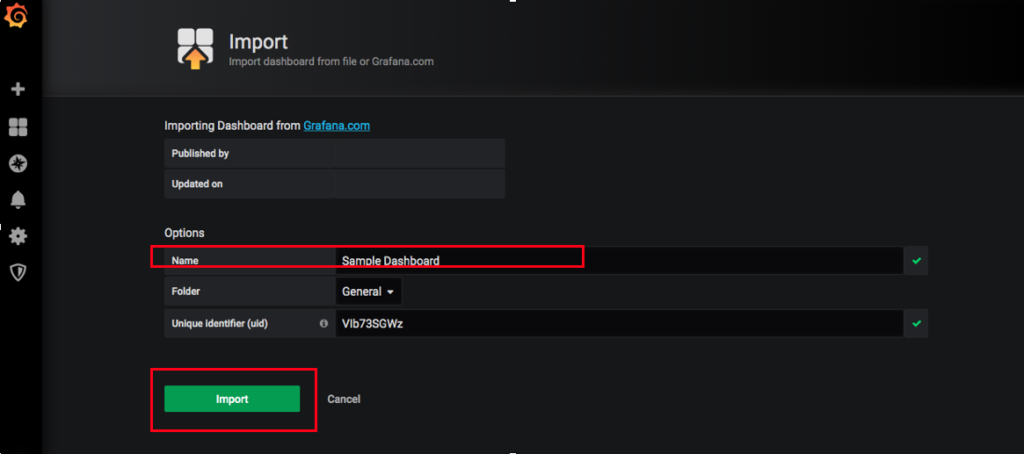
Now Click On import and paste the json of your Dashboard as shown in the screenshot below,
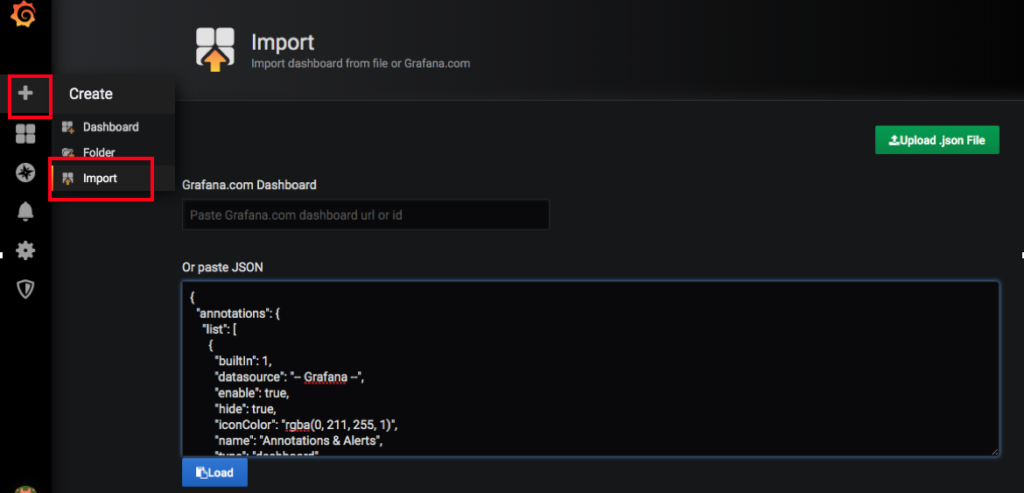
Give the name of the Dashboard and Click Import.
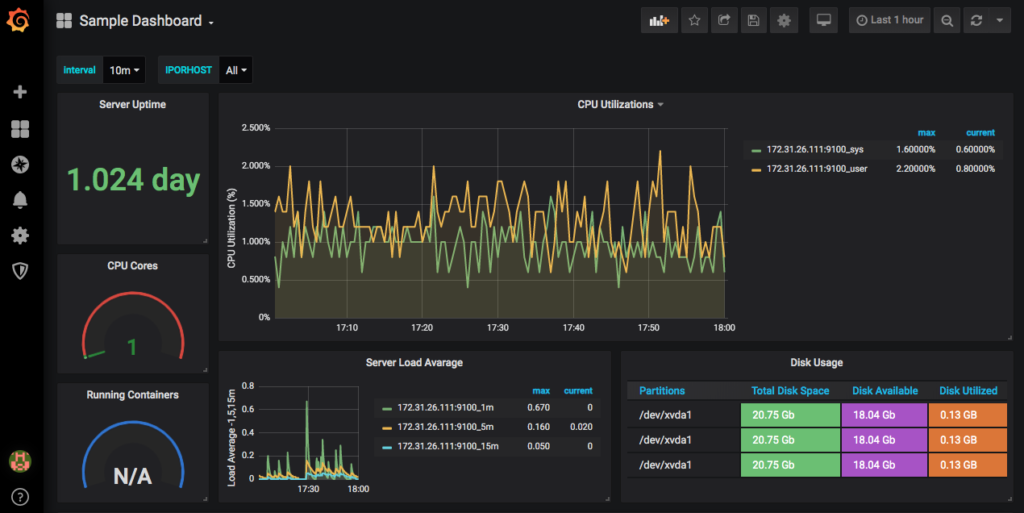
Once You Click on Import, You will be able to see the dashboard as below,
That’s it for this Particular Article, You Can design your own Dashboard and it might look more beautiful than others. For more details just have a look at the Grafana official Dashboard page, where you can have some cool Dashboard.
If you Like Our Content here at Devopsage, then please support us by sharing this post.
Please Like and follow us at, LinkedIn, Facebook, Twitter, and GitHub
Also, Please comment on the post with your views and let us know if any changes need to be done.
Thanks!!
You May Also Need to Look Into,
Monitoring Servers and Docker Containers using Prometheus and Grafana.
Notification to Slack using Prometheus AlertManger