In the last post, we have seen how we can Monitor our Server and can get notified for any of the Alerts using the Alert manger. In this Blog, We Will See how we can Set an Alert and Send Notification to Slack using the Grafana Embedded Alerting System.
We Assume that You have grafana Dashboard Up and Running along with the basic dashboard. If not, you can have a look at our previous blog on how to create a dashboard in grafana.
Prerequisite,
Grafana Up and running,
Basic Grafana Dashboard.
A Slack Workspace
Generated InComing WebHooks for Slack Channel
Let’s Get Started,
In this, We Will Test the Alerting for the High CPU Utilization of the same Server in which Grafana and other tools are installed.
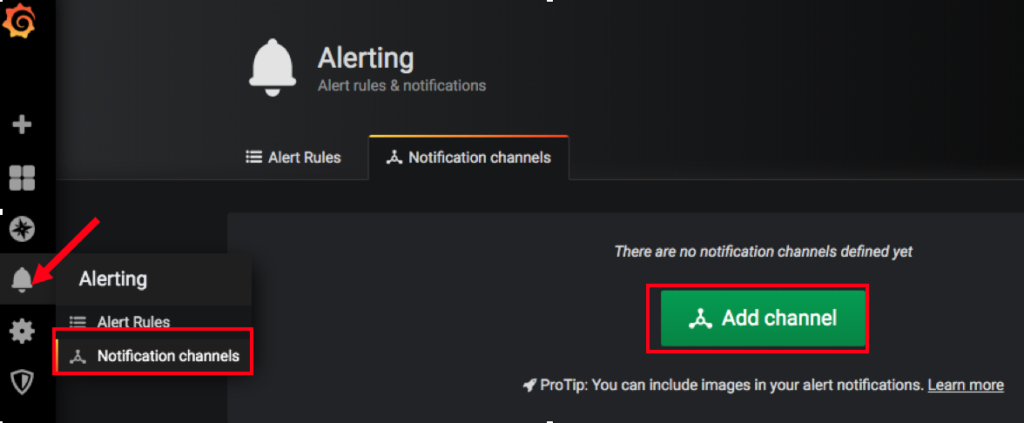
First of All, We have to Create a Notification Channel using the Slack Incoming webhooks we have generated. Open Grafana and Click on the Bell Icon from the Navigation Pane and Select notification Channel and then click on Add Channel.
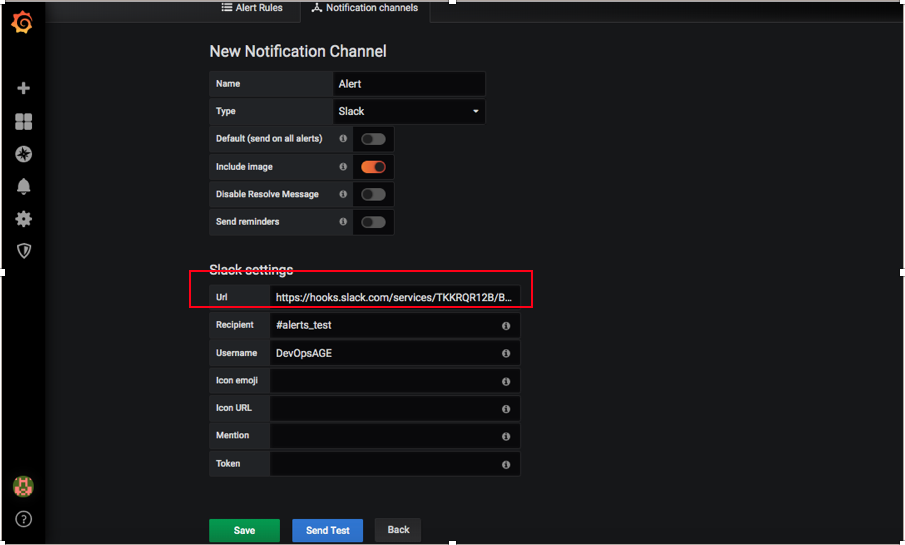
provide the Required Details there like, Name, Select Type as Slack, Provide the Slack Incomming Webhook URL, Recepient, Username etc, and then Click on Send Test.
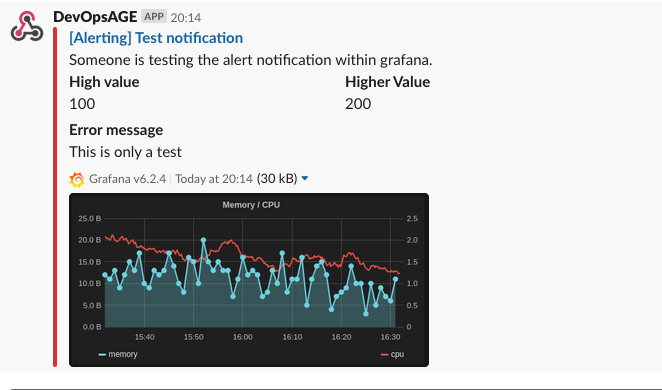
So as you Click on Send test, you Will Receive a Test Notification In the Slack Channel,
Now Click Save to Save the notification channel you have created.
As We are done with creating the Notification Channel, Lets create an Alert for your Metrics. Select CPU Metrics and Click Edit

Now, Click on the Bell Icon and Click Create Alert, As shown in the Screenshot below
![]()
Define you Threshold and Create an Alarm. Here we have defined rule that if the CPU Utilisation is Above 50% the Send Notofication to the Slack Notification channel That we have added.

In the Notification Channel, Add the Notification Channel Created and Write small Alert message. So Now Once You have added this, It will Keep on monitoring the Metrics graph and Once it Goes beyond 50% It Will trigger an Alert on the Slack Channel.
Note: This Will Only Trigger the Alert Message to Slack, and also notify about the recovery. This Will not take the Snapshot of the metrics and Post to slack like the way it posted when we Send the Test Notification While Creating the Alert Channel. If you want to capture the Alert Metrics Image then please have a look here.
If you Like Our Content here at Devopsage, then please support us by sharing this post.
Please Like and follow us at, LinkedIn, Facebook, Twitter, and GitHub
Also, please comment on the post with your views and let us know if any changes need to be done.
Thanks!!
You May Also need to look into,
Notification to Slack using Prometheus AlertManger
Creating Dashboard in Grafana
Monitoring Servers and Docker Containers using Prometheus and Grafana.
How to Add Nodes to be Monitored in Grafana